If there’s one treasure trove that SEOs know of, that would be Google Analytics. It’s one of the free tools that Google offers and the easiest to use.
At its most basic, Google Analytics tracks and analyzes the visitors to a website. Hence, determining whether that site is in its optimal condition is possible. If it lags behind its competitors, the tool can also show ways how to tweak it for better site performance based on your campaign goals.
In this time of upheaval, we all call the coronavirus pandemic exhausted companies’ marketing budgets in the second quarter of 2020. Google Analytics has been instrumental in steering the company in the right direction. First, it compels firms to focus on the most strategic and profitable campaigns. Second, it allows businesses to concentrate on short-term campaign KPIs.
Everything you will need to improve your website is there. You just have to know which ones to drill down. But how does Google Analytics help in responding to pandemic-related challenges? Here’s how.
Making sense of Google Analytics
1) Tracking the right metrics
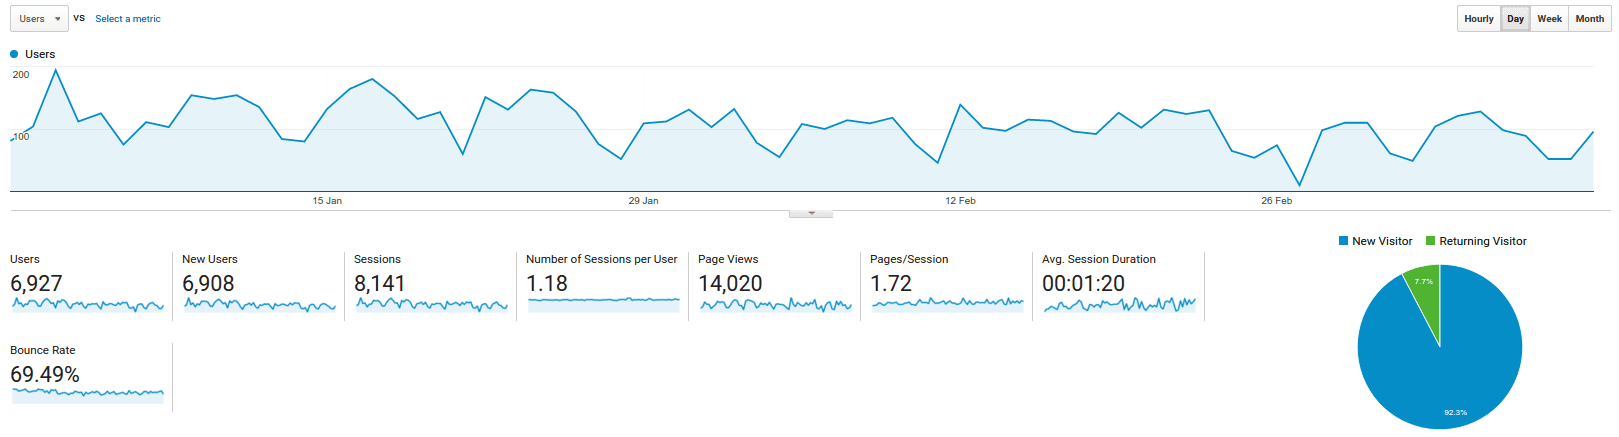
Apparently, the health crisis shifted the customers’ shopping behaviors. One of the best features of Google Analytics is the customizable metrics. These parameters are configured so you can dig deeper into the data presented by the tool to inform your reporting nonetheless.
Among these metrics, the most important are:
Conversion
It refers to the total number of visits within a particular period that turns into potential or actual customers.
If this figure is negative or below the targeted rate, which you can compare pre and during the pandemic, then there’s a problem within your site, especially the contact us page and calls to action. You might want to look into the targeted landing pages since there might be a mismatch between the targeted keywords and these pages.
Session duration
This refers to the length of time the visitors spent on your website. If this is low or negative, it means that the bounce rate (or the percentage of visitors leaving the site after viewing a single page) is high.
Put simply, there is a lack of dwell time, and it tells much about user experience (UX) or the lack thereof, wherein you should tap the services of a digital marketing agency. Another factor to look at is your site’s navigability and the content that might not be engaging at all.
Organic search
From the name itself, it refers to the total number of visitors who landed on your website from a link on a search engine results page (SERP).
If the number is too small, it only means that your landing pages are not ranking on SERPs. There are many factors at play here other than the UX design of your site.
You should look at other ranking factors like speed and security and the metadata implementation at the landing page level. Look into the robots.txt also as Google may not be able to crawl and index some pages as indicated in the file.
Investigate the top content also. Which pages are attracting the most visitors? Which content resonates best with the target audience during the pandemic? Then, create more of that content.
2) Setting up social campaigns
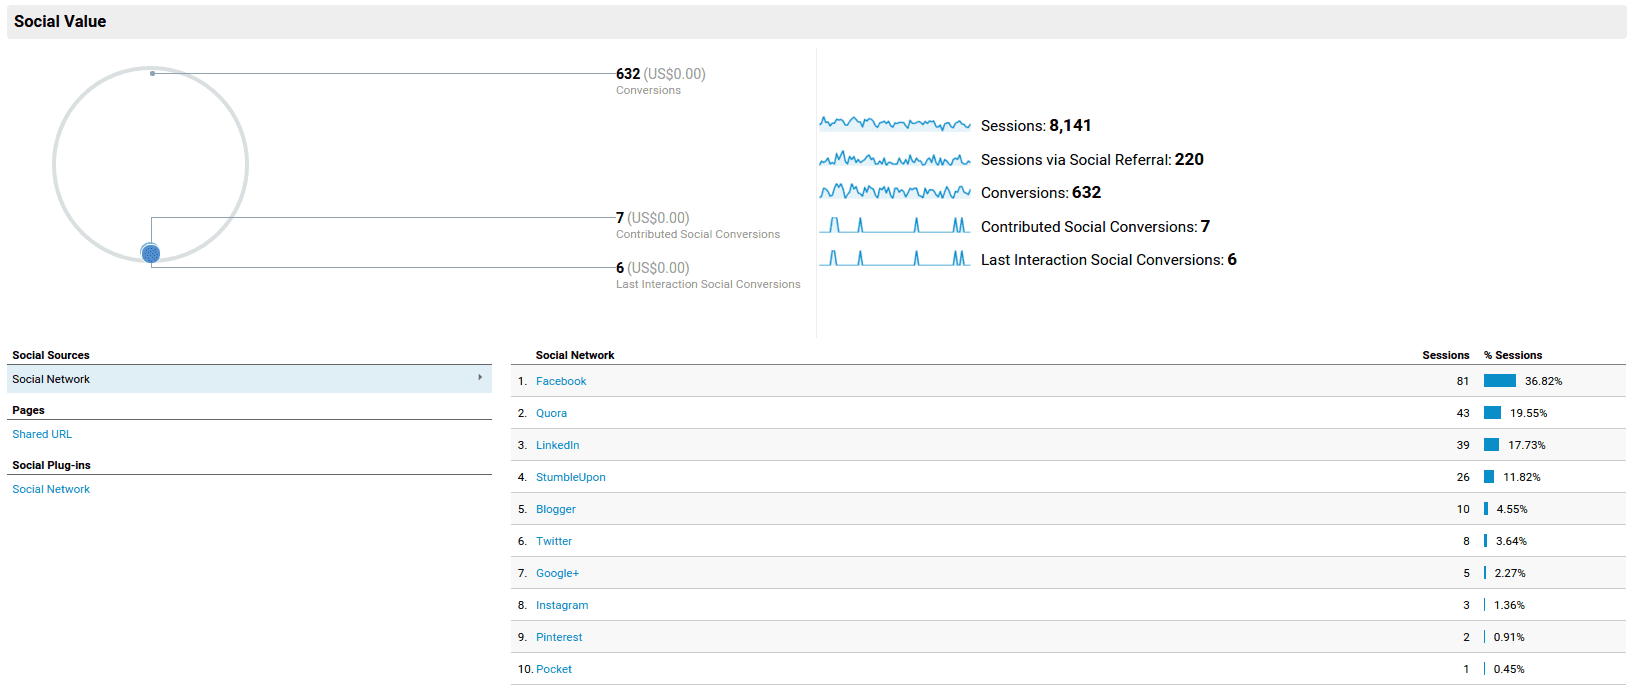
When there’s SEO, there is also social. These campaigns are often considered interrelated. Track a social media marketing campaign by plugging it into Google Analytics under the Social Settings section. Through this, you may also monitor conversions and track landing pages, among others.
Under the social tab, you may instantly see your website’s social value in terms of your conversions. The numbers alone can easily tell you if you are hitting the right targets or not. You may also check the pages and social plugins that provide the most conversions concerning share and other engagement points. For instance, you can determine the elements that make these pages share-worthy. Change your content plan if necessary.
If the numbers are low, then it also means engagement on your chosen social media platforms is rather low. There might be a need to re-strategize to target the right segment using the right social channel.
Otherwise, it will only be a waste of marketing budget whether you are targeting the right segment on the wrong platform or vice versa or targeting the right segment using the right platform but using the wrong type of content. These insights can be drawn from using Google Analytics alone.
3) Tracking mobile performance
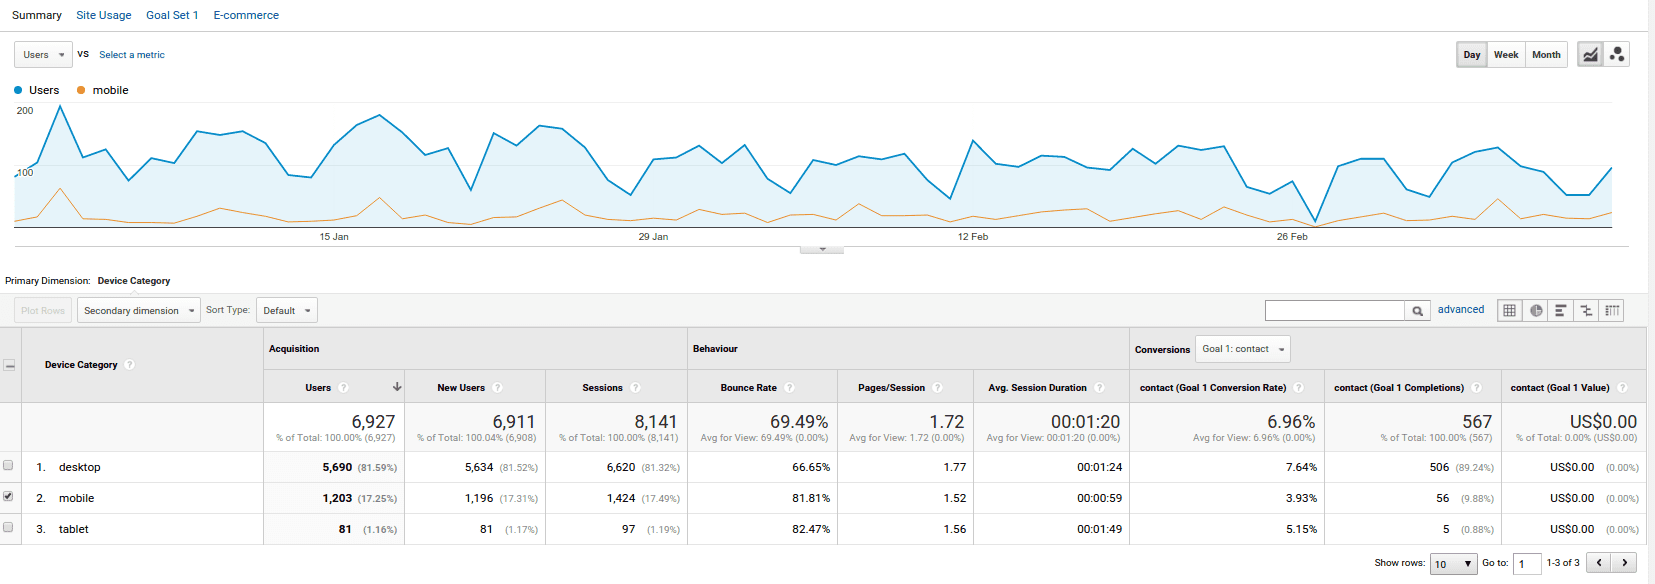
Nowadays, the discussion revolves around accelerated mobile pages or progressive web apps—both concepts thrive on making content available and consumable on mobile devices. It is no longer about making your website mobile-friendly because you really have to. Users are becoming more mobile-first and are only using desktop computers when they have to.
Thankfully, Google Analytics can show your website’s mobile data to determine where you can improve. Go to your mobile audience and check the acquisition, behavior, and conversion.
Acquisition
Look at the total number of users, new users, and sessions. You should see an ascending or steady pattern. If the numbers are declining, test your website in terms of its mobile-friendliness. You might be missing some points here, particularly how fast (or slow) your page loads on mobile devices.
Behavior
Although this may depend on the goal(s) you set, strive for at least two minutes of average session duration with higher average views. Without these, the website may be experiencing high bounce rates. Investigate this and tweak it where necessary. Make sure that your website follows Google’s mobile guidelines.
Conversions
Examples of conversions are inquiry and contact us form completion. If the percentages are high despite the high bounce rates, that means the website has a high number of missed opportunities. Your goal now is to test landing pages and exit pages to lower the bounce rates.
4) Generating the custom reports
With the above two, the goal is to create reports based on your configured metrics. Nevertheless, the reports should show the following as basic metrics.
Acquisition
Th
This report shows where the actual traffic comes from. This report alone can tell you if your site has a diverse backlink profile. If it comes from poor-quality sites, it is high time to rethink your link building strategies before Google thinks of your site as spam.
Yes, the search engine now looks into the sites’ quality linked back to your website, so you must proceed cautiously.
Conversion
Of course, the report must show figures pertaining to the conversion rate. Again, this may depend on the goal, like a thousand newsletter subscribers or contact us page completions from period A to period B.
The thing is, the report can show whether key performance indicators (KPIs) are met or not and move on to the next probable action.
Keywords and landing pages
The report must outline the search terms the users use in landing on specific pages on the website. It must also show the exit pages. Your website’s findability lies in properly using and disseminating keywords within site and corresponding landing pages.
If you know the most commonly used keywords and frequently landed pages, you may quickly determine the elements that attract visitors to a particular page, for instance.
Google Analytics can provide real figures to determine whether your site is performing at its best or not. If not, then the tool also gives you the metrics you should be looking at initially.
This doesn’t mean you should look at the entire analytics report because, as mentioned above, the tool is a treasure just waiting to be discovered.
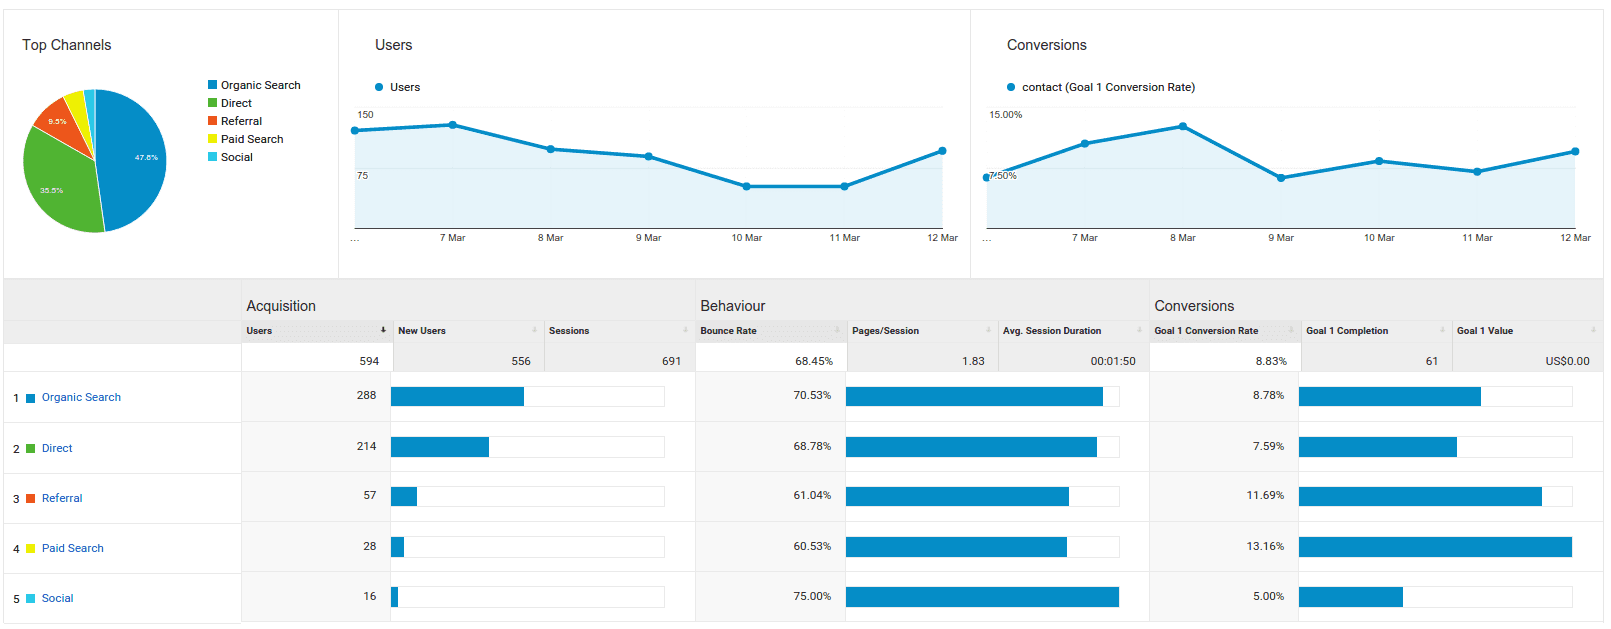
A pivot
In measuring business activities, start with Acquisition > All Traffic > Channels. Then, you may simply compare date ranges such as the last 30 days or custom. Indicate the preferred range and the point of comparison, such as the previous year.
In this way, you’d know how your website performed during the pandemic against last year’s performance. Make sure that you check the overall changes and the changes for each channel. Check for users, sessions, transactions, and conversion rates. Finally, check the revenues.
- Are there any significant changes in revenues? Are they higher, lower, or unchanged?
- Which channels perform the best? Paid or organic search?
- Are there any significant changes in conversion rates?
Speaking of paid search, you must also scrutinize the ads’ performance by going to Acquisition > Google Ads > Campaign > Clicks. You may also compare the PPC performance by year.
Focus on the changes in ROAS or the return on ad spend. Nonetheless, you must also look into the ad groups, keywords, and search queries. These are indicative of new opportunities to explore.
If you are selling products, go to Conversions > Ecommerce > Product Performance. Compare the products and their categories to determine which ones the target consumers are looking for and buying.
Finally, if you operate in multiple locations, it is best to look into the performance of products or services by going to Audience > Geo > Location. Here, you will fully grasp which countries brought in the most sales.
You may also compare the performance of each location against that of the previous year. So you’d know which locations to focus on.
Based on the results of your comparisons and analysis, make the necessary changes.
- Update the homepage to showcase or feature the best-selling products or services
- Optimize the product pages of the best-selling products or services
- Create more content that addresses the pain points of the target consumers
- Shift the inventory of top-selling products or services
- Identify new product opportunities and produce the goods immediately
- Fine-tune paid search and other advertising activities
- Push more marketing activities on the most profitable locations
Bottom-line, businesses must monitor KPIs frequently. Fix any problem you will find on your website and ad copies. Seize whatever opportunities you can spot so your business stays afloat during these unprecedented times.